
Interpreting the Dashboard Information |
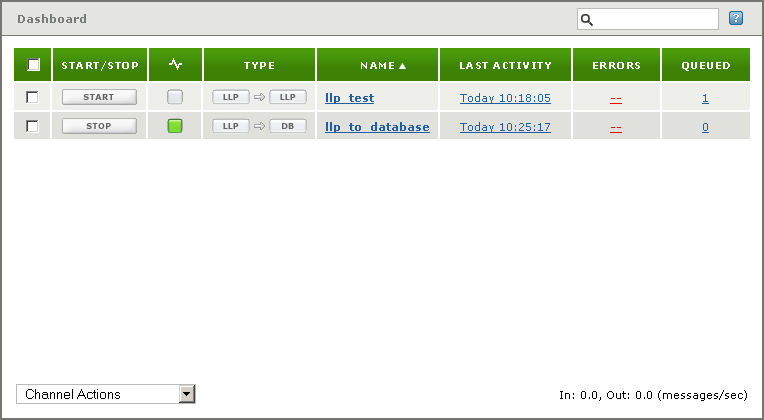
To understand the dashboard information that Iguana generates, take a look at this simple example of a server for which two channels have been defined:

If you export this server's dashboard information in XML format, it looks like this:
<IguanaStatus DateTime="20091211102834" NumberOfChannels="2" NumberOfRunningChannels="1" NumberOfLicensedChannels="0" TotalLogs="" TotalSuccessLogs="" TotalSourceErrorLogs="" TotalDestinationErrorLogs="" TotalErrors="0" TotalServiceErrors="0"> <Channel Name="llp_test" Status="off" Source="LLP Listener" SourceStatus="off" Destination="LLP Client" DestinationStatus="off" SuccessLogs="" SourceErrorLogs="" DestinationErrorLogs="" TotalErrorLogs="0" MessagesQueued="1" TotalProcessed="2" CurrentProcessed="2" LastActivityTime="20091211101805"></Channel> <Channel Name="llp_to_database" Status="on" Source="LLP Listener" SourceStatus="on" Destination="To Database" DestinationStatus="on" SuccessLogs="" SourceErrorLogs="" DestinationErrorLogs="" TotalErrorLogs="0" MessagesQueued="0" TotalProcessed="1" CurrentProcessed="1" LastActivityTime="20091211102517"></Channel> </IguanaStatus> |
This XML file contains an <IguanaStatus> element that describes the server status, and one <Channel> element for each defined channel.
The table below describes the fields that are defined for the <IguanaStatus> element:
| Field | Description |
|---|---|
| DateTime | The date and time of the dashboard information request. |
| NumberOfChannels | The number of channels defined for this server. |
| NumberOfRunningChannels | The number of channels currently running. |
| NumberOfLicensedChannels | The maximum number of channels that this server is licensed to run. |
| TotalLogs | This field was defined in older versions of Iguana, and is not presently in use. |
| TotalSuccessLogs | This field was defined in older versions of Iguana, and is not presently in use. |
| TotalSourceErrorLogs | This field was defined in older versions of Iguana, and is not presently in use. |
| TotalDestinationErrorLogs | This field was defined in older versions of Iguana, and is not presently in use. |
| TotalErrors | The number of service errors and channel log errors detected. |
| TotalServiceErrors | The number of service errors detected. (This is the number displayed in the Service Errors field on the Dashboard Control Panel.) |
The table below describes the fields that are defined for the <Channel> element:
| Field | Description |
|---|---|
| Name | The name of the channel. |
| Status | The status of the channel. This is one of the following: on: channel is running (status is green) off: channel is stopped (status is grey) ...: channel is pending (status is yellow) error: an error has occurred (status is red) |
| Source | The source component of this channel. |
| SourceStatus | The status of the source component of the channel. This is a legacy field from earlier versions of Iguana, which maintained separate statuses for the channel and its components. In Iguana 4.0 or later, SourceStatus has the same value as Status. |
| Destination | The destination component of this channel. |
| DestinationStatus | The status of the destination component of the channel. This is a legacy field from earlier versions of Iguana, which maintained separate statuses for the channel and its components. In Iguana 4.0 or later, DestinationStatus has the same value as Status. |
| SuccessLogs | This field was defined in older versions of Iguana, and is not presently in use. |
| SourceErrorLogs | This field was defined in older versions of Iguana, and is not presently in use. |
| DestinationErrorLogs | This field was defined in older versions of Iguana, and is not presently in use. |
| TotalErrorLogs | The number of error log messages generated for this channel. |
| MessagesQueued | The number of messages queued for processing by this channel at the time the dashboard information was obtained. |
| TotalProcessed | The total number of messages processed by this channel. (This is the number displayed in the Total Processed field in the channel's Control Panel.) |
| CurrentProcessed | The number of messages processed by this channel since the message count was last reset. (This is the number displayed in the Current Processed field in the channel's Control Panel.) |
| LastActivityTime | The date and time of the last activity in this channel, displayed in YYYYMMDDhhmmss format. |
|
New Feature in Iguana 4.1 The TotalProcessed, CurrentProcessed and LastActivityTime fields are new in Iguana 4.1. | ||
 |
| In Iguana, the maximum number of errors retained for each channel is 50. | ||
 |
When you export the dashboard information in text format, the fields defined are identical to those used in the XML format:
20091211104326, 2, 1, 0 , , , , 0, 0 "llp_test", "off", "LLP Listener", "off", "LLP Client", "off", , , , 0, 1, 2, 2, 20091211101805 "llp_to_database", "on", "LLP Listener", "on", "To Database", "on", , , , 0, 0, 1, 1, 20091211102517 |
In the text format dashboard information, the first two lines specify server data, and each subsequent line specifies the data for a channel.
The following table lists the fields specified in the two lines of server data included in the text format dashboard information file. (See the table above that describes the <IguanaStatus> XML element for an explanation of what these fields are.)
| Line in Dashboard Information Text File | Fields Defined |
|---|---|
| Line 1 | DateTime NumberOfChannels NumberOfRunningChannels NumberOfLicensedChannels |
| Line 2 | TotalLogs TotalSuccessLogs TotalSourceErrorLogs TotalDestinationErrorLogs TotalErrors TotalServiceErrors |
Each line of channel data in a text format dashboard information file contains the same fields as the equivalent <channel> element in the XML format file. The fields are in the same order as in the XML format file. See the table above that describes the <channel> XML element for more details.