
Checking the Dashboard and Logs |
To ensure your data is being filtered out to the appropriate sub-channels, you should first check the Iguana Dashboard and logs. The Dashboard displays information on whether errors have been detected, and the logs display every message that Iguana receives.
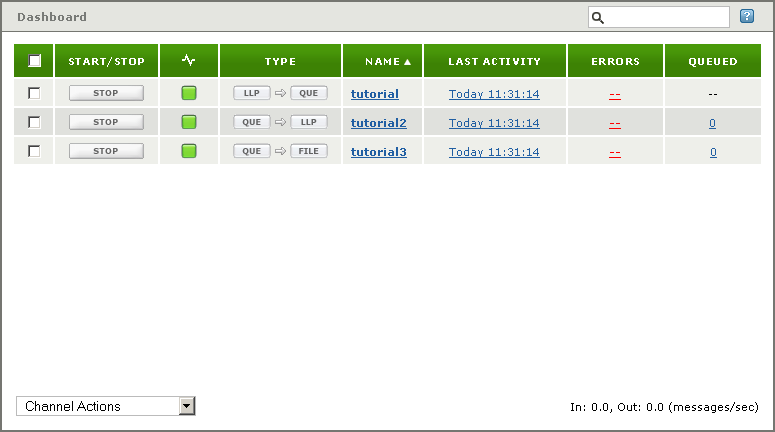
To view the dashboard, click the Dashboard tab. The Dashboard appears, which displays the active channels and indicates whether any errors have occurred:

The Errors column lists whether any errors have occurred.
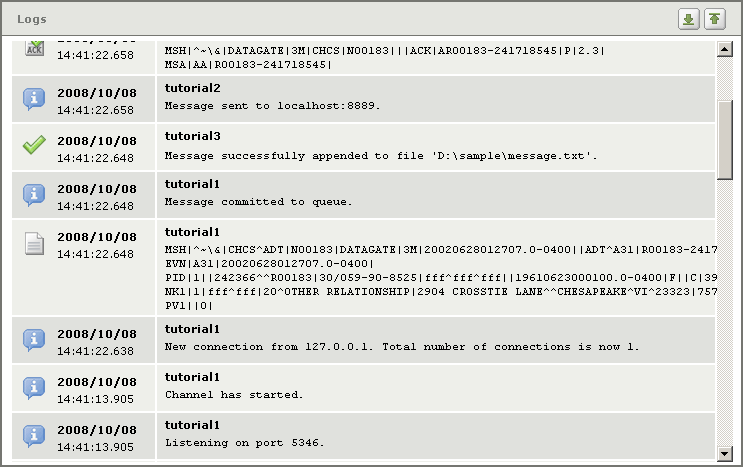
To view the message in the Iguana logs, click the Logs tab and scroll down until the message is displayed:

Notice that the name fields have been replaced by fff. This indicates that the transformation was performed before the message was logged and before it was routed to the two destination channels.